Showing posts with label Newtown Home Market Facts. Show all posts
Friday, October 26, 2012
Saturday, August 18, 2012
Newtown Township Home Sale Statististics
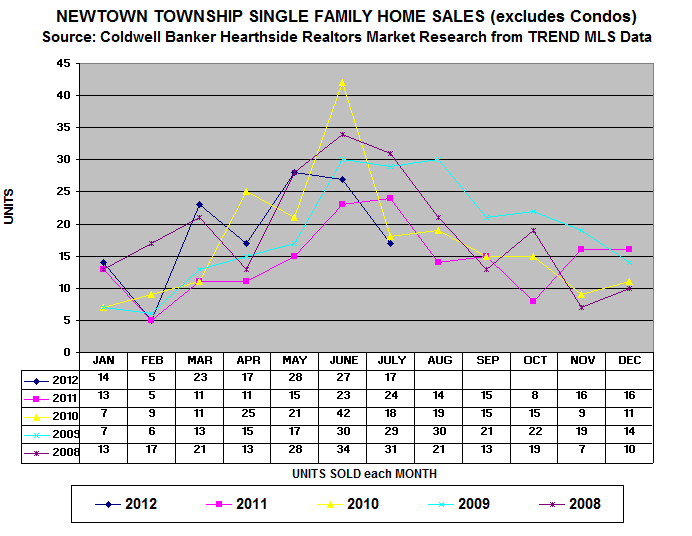
The number of homes sold this year in Newtown Township through July, 2012 has significantly increased. There was a dip in July but the overall trend is positive. In fact, there were 32% fewer homes for sale in July, 2012 compared with the number for sale in July, 2011.
Average prices in the township fluctuate considerably due to the sales of new construction homes that are priced above the average sale price of existing homes within the township.
A better indication of home sale prices for existing homes in Newtown Township is the statistics for Bucks County. Prices in Bucks were up 1.5% if the average price of sold homes for July, 2012 is compared to the average price of sold homes in July, 2011. However, if home prices for the first seven months of 2012 are compared to the first seven months of 2011, prices were down 1.9%.
It is too soon to tell whether prices have bottomed out, but statistics indicate prices are relatively stable as compared the declining prices experienced since 2006.
This chart shows the month by month and year by year fluctuations in home sales over the last few years.
Average prices in the township fluctuate considerably due to the sales of new construction homes that are priced above the average sale price of existing homes within the township.
A better indication of home sale prices for existing homes in Newtown Township is the statistics for Bucks County. Prices in Bucks were up 1.5% if the average price of sold homes for July, 2012 is compared to the average price of sold homes in July, 2011. However, if home prices for the first seven months of 2012 are compared to the first seven months of 2011, prices were down 1.9%.
It is too soon to tell whether prices have bottomed out, but statistics indicate prices are relatively stable as compared the declining prices experienced since 2006.
This chart shows the month by month and year by year fluctuations in home sales over the last few years.
Tuesday, November 8, 2011
Newtown Township Home Sale Statistics 1/1/2011-9/30/2011
SINGLE FAMILY HOMES
Market Facts1/1/2011-9/30/2011
______________
Source: COLDWELL BANKER HEARTHSIDE REALTORS MARKET RESEARCH from TREND MLS Data
· There were 151 single family homes for sale in September 2011.
· There were 130 single family homes for sale in September 2010.
Inventory is up 16.2% year over year,
· Average price of single family homes for sale in September 2011 was $410k
· Average price of single family homes for sale in September 2010 was $465k
This increase is due to relatively high priced new construction homes being sold within the township.
· 131 homes sold during the first nine months of 2011 at 93% of list price
· 167 homes sold during the first nine months of 2010 at 95% of list price
Unit Sales volume is down 21.6% year over year.
Actual Selling Prices are averaging about a 7% below the Original List Price
Summary: Inventory levels are up and year to date unit sales are down compared to the same period last year. The market is in “Buyers Market” territory with a 10.9 Month Supply of Homes in Inventory.
Note that a Market is viewed as “Balanced” with a 6 Months Inventory of homes for sale.
What does this mean to a Seller?
There is almost an 11 Month Supply of homes on the market, and generally taking about 70 Days on Market to sell, vs. 51 Days on Market last year, so selling conditions are relatively challenging. It is more important now than ever to price your home right and market aggressively. You may not have enjoyed the per year appreciation in 2007-2010 versus the ~10% experienced during most of the prior 3-4 years. Be realistic and remember the current market is what determines the price of your home.
Subscribe to:
Posts (Atom)

