The past several years have been tough for homeowners who were trying to sell their homes or hoping to increase their equity. Will the next few years be any better?
No one has a crystal ball, but the predictions made by Fiserv's chief economist are in line with the opinions I've heard from others in the field.
According to an article in the December issue of Money magazine, Fiserv predicts a choppy real estate market in 2013 with prices increasing 3.4% from midyear 2013 to midyear 2014. That trend should continue with an annual increase in values of about 3.3% over the next five years. Keep in mind that these are national projections and local markets will vary.
The predicted annual increase of 3.3% may seem modest compared to the double digit increases between 2000 and 2006, but those increases were caused by loose mortgage lending practices and real estate speculation.
Many older homeowners have been spoiled by the rapid increase in home values since the 1970's when the Baby Boomers entered the housing market. Much of the rise in home prices between the 1970's and 2000 was due to the increased demand for housing by this large demographic group. Now that the Baby Boomers are settled in homes, or are downsizing, demand for housing should more closely match the supply, and prices are likely to appreciate more slowly than they did during that period.
Tuesday, November 27, 2012

Friday, October 26, 2012


Saturday, October 20, 2012
Lower Makefield Home Sale Statistics
The number of single family homes for sale as of September 30, 2012 significantly decreased by 26.7% compared to the number of homes for sale on that date in 2011. Some of the decrease is due to fewer sellers listing their properties, but there was also a 7.2% increase in the number of sales during the first nine months of 2012 compared with the same period in 2011. These factors decreased the number of available homes.
Prices are stabilizing. The listing price as of the end of September was down .6% compared to the end of September 2011. The average listing price for a home in Lower Makefield is now $470,000 compared to $473,000 for the prior year.
No one is predicting that prices will reach their 2006 levels in the near future, but the current signs indicate the market is stabilizing.
The following chart shows that the number of sales for 2012 has been fairly good compared to the number of sales for prior years.

Prices are stabilizing. The listing price as of the end of September was down .6% compared to the end of September 2011. The average listing price for a home in Lower Makefield is now $470,000 compared to $473,000 for the prior year.
No one is predicting that prices will reach their 2006 levels in the near future, but the current signs indicate the market is stabilizing.
The following chart shows that the number of sales for 2012 has been fairly good compared to the number of sales for prior years.

Monday, October 15, 2012
Bucks County Home Sale Statistics Thru 9/30/12
What a difference a year makes!
The number of single family homes sold in Bucks County during September, 2012 was significantly higher than for September, 2012. The number of homes for sale decreased by 10.3%. The following chart, provided by TrendMLS shows the statistics
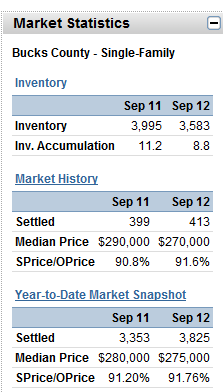 It is still a buyers' market, but sellers are gaining more leverage with the decrease in the number of homes on the market.
Prices have not risen. In fact the average sale price of single family homes in Bucks County during the first nine months of 2012 was $275,000 compared to $280,000 during the same period in 2012.
The number of single family homes sold in Bucks County during September, 2012 was significantly higher than for September, 2012. The number of homes for sale decreased by 10.3%. The following chart, provided by TrendMLS shows the statistics

Prices have not risen. In fact the average sale price of single family homes in Bucks County during the first nine months of 2012 was $275,000 compared to $280,000 during the same period in 2012.
Tuesday, September 25, 2012
Learn More About Bucks County
People from out of the area frequently ask me about the characteristics of Bucks County and what there is to do here. The topic is so broad that my response can only hit the highlights. Here is a great website that provides considerable detail on that subject:
http://buckscountyalive.com/events/ShowEvents.cfm?webname=bcalive

http://buckscountyalive.com/events/ShowEvents.cfm?webname=bcalive

If you currently live in the area, it's a great website to learn about local services and special events in the area. For families with children, the current scarecrow competition at Peddlers Village is a nice activity.
For art lovers, the annual juried art show at Phillips Mill showcases some of the best art currently being produced by local artists.
Thursday, September 20, 2012
Bucks County Home Sales Statistics Through August 2012
The Bucks County Residential Real Estate Market appears to have bottomed out and is now showing signs of improvement.
Statistics for August 2012 vs. August 2011 show an 8.7% drop in the number of homes for sale and a 23.9% increase in the number of homes that settled.
Sale price information is less conclusive.
Figures for 2012, as compared to August figures for 2011, would suggest prices have risen by 7.4%; however, year to date figures for the first eight months of 2012 compared to the first eight months of 2011 show a very slight decrease in prices. Different periods of time produce notably different figures.
Home prices have leveled out but cannot be expected to rise quickly. The unprecedented rise in home prices between 2000 and 2006 was artificially created by loose lending practices. We cannot expect home values to again reach their 2006 levels for many years to come.
Now is a great time for buyers to purchase a home. Mortgage interest rates are extremely low and home market prices do not seem to be getting any lower. For those waiting for the market to bottom out, this may be it.

Statistics for August 2012 vs. August 2011 show an 8.7% drop in the number of homes for sale and a 23.9% increase in the number of homes that settled.
Sale price information is less conclusive.
Figures for 2012, as compared to August figures for 2011, would suggest prices have risen by 7.4%; however, year to date figures for the first eight months of 2012 compared to the first eight months of 2011 show a very slight decrease in prices. Different periods of time produce notably different figures.
Home prices have leveled out but cannot be expected to rise quickly. The unprecedented rise in home prices between 2000 and 2006 was artificially created by loose lending practices. We cannot expect home values to again reach their 2006 levels for many years to come.
Now is a great time for buyers to purchase a home. Mortgage interest rates are extremely low and home market prices do not seem to be getting any lower. For those waiting for the market to bottom out, this may be it.

Friday, August 24, 2012
Lower Makefield Home Sales Through 7/30/12
The number of homes sold in Lower Makefield Township in 2012 has significantly increased as compared to the number sold during the same time period in 2011.
Check out this chart to see the monthly and yearly changes in home sales in Lower Makefield Township.

Check out this chart to see the monthly and yearly changes in home sales in Lower Makefield Township.

Subscribe to:
Posts (Atom)